As most of us know, our planet is changing on several fronts such as climate change, polluted oceans, biodiversity declines, land degradation, and so on. But Earth is a big place and keeping tabs on these changes is huge task. There is currently one tool at our disposal that can provide us with the big picture about the health of our planet. That tool is the system of satellites that observes Earth day and night.
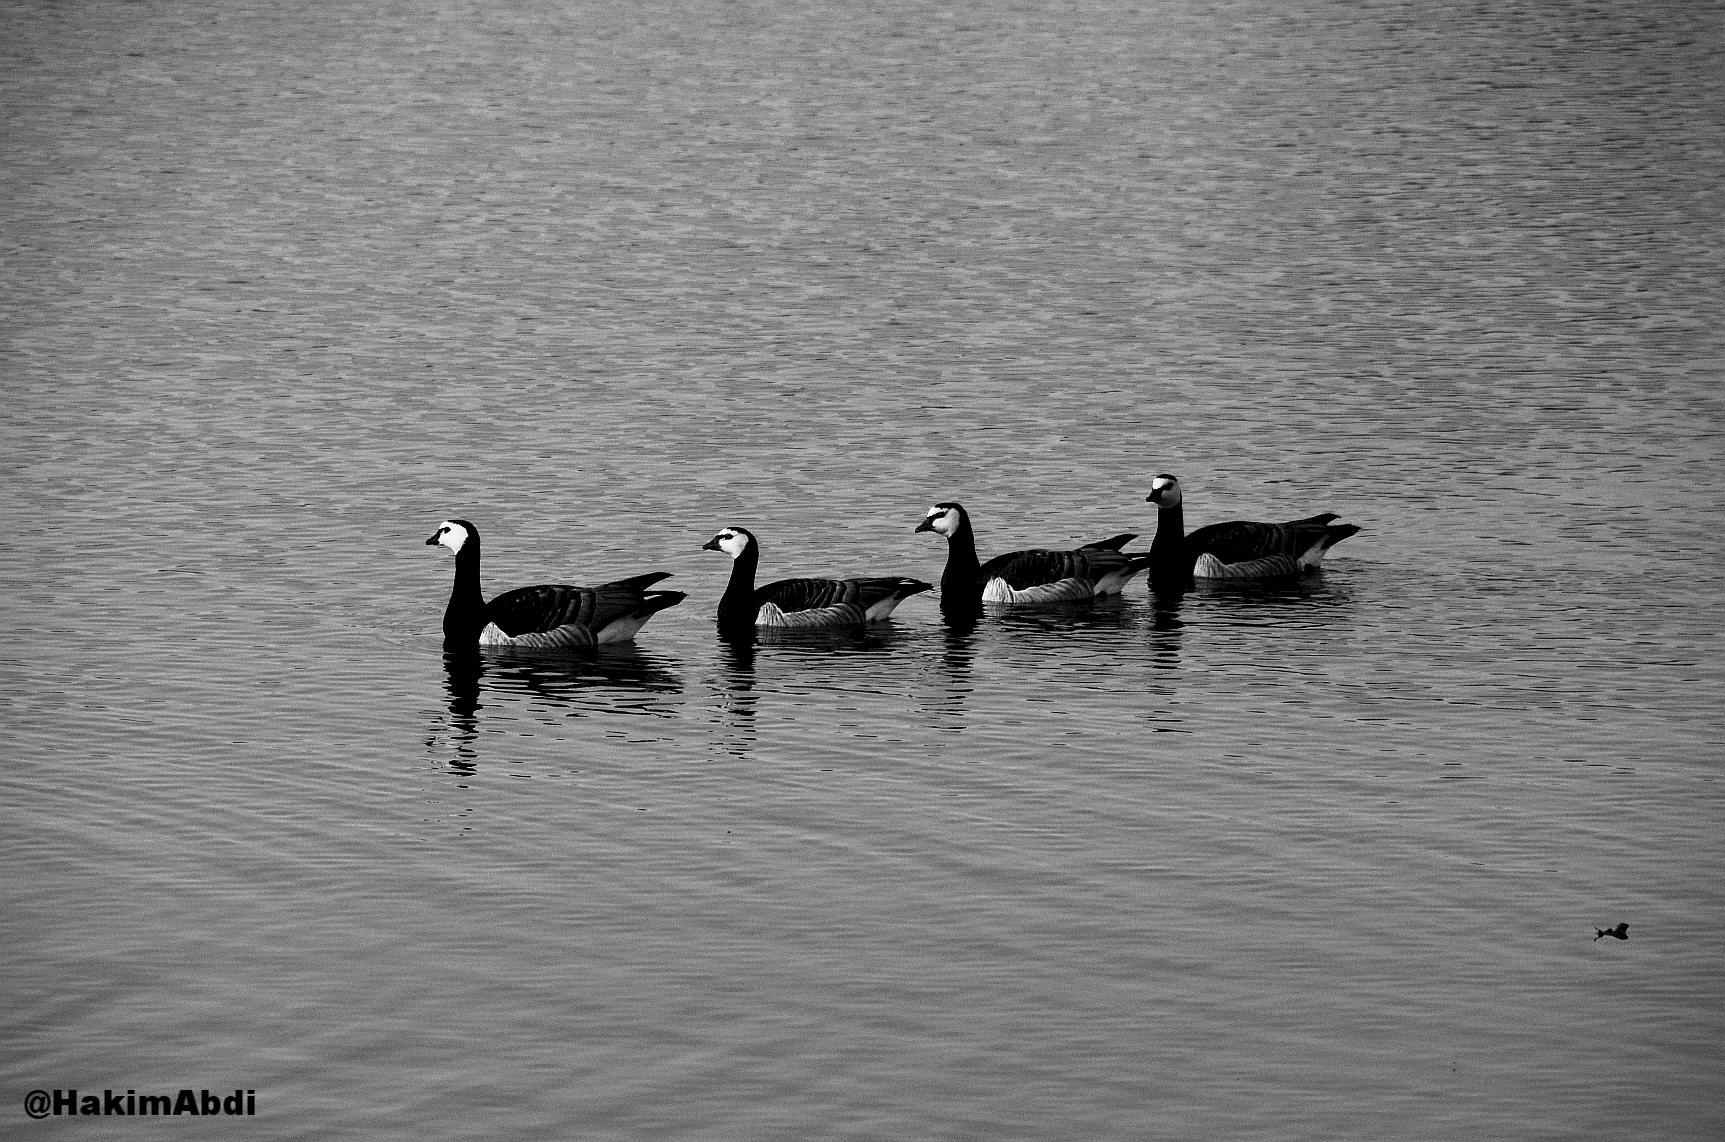
Biodiversity is a complex term but it essentially encompasses life in all its variety, ranging from individual genes to entire ecosystems. The legendary biologist Edward O. Wilson defines biodiversity as “the totality of all inherited variation in the life forms of Earth”. The loss of biodiversity due to human activities and its negative effect on ecosystems are well documented.
Should scientists be concerned if their research output is inaccessible to non-experts? Put another way, should scientists make an effort to communicate their science to the wider public? I posed these questions to a group of graduate students and postdocs and the feedback was mixed. On the one hand, there were legitimate concerns about the time and skill needed to “translate” complex science into an accessible language. On the other hand, there was strong support for science communication as part of a scientist’s moral and professional duty.