
Behind the Paper: Satellite remote sensing and landscape metrics to characterize IBAs and aid the conservation of migratory birds
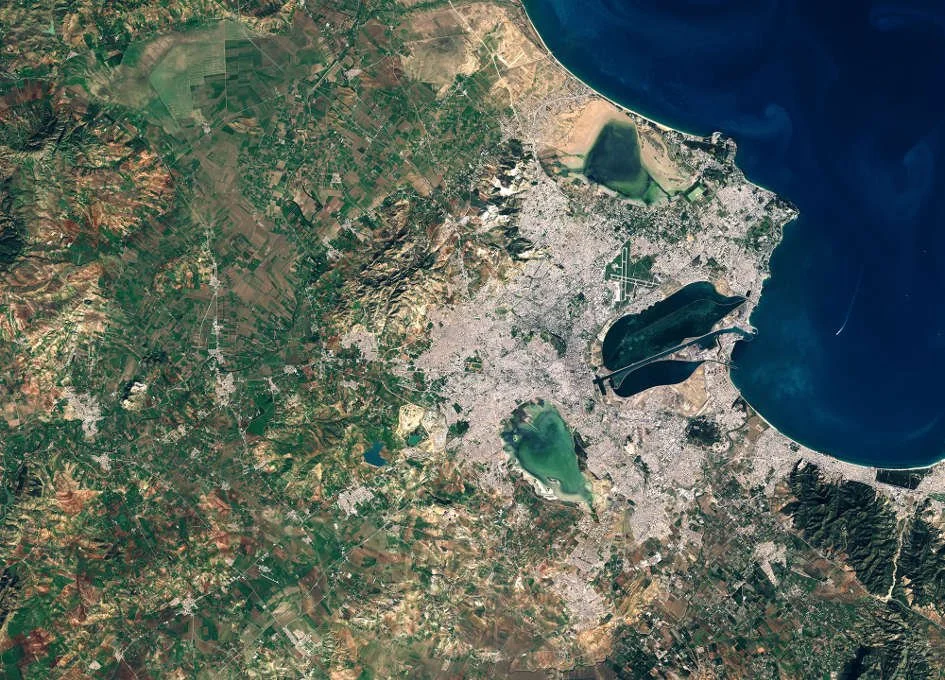
The conservation of species within Important Bird and Biodiversity Areas (IBAs) is critical, particularly in regions like Tunisia where wetlands serve as vital habitats for a wide array of waterbird species, including several that are globally threatened. In our recently published study on the conservation of wintering waterbirds within IBAs in Tunisia, we leveraged cutting-edge satellite remote sensing techniques to unravel the intricate dynamics between landscape structure and waterbird communities. This research is particularly novel as it integrates remote sensing data to assess the influence of wetland characteristics and surrounding landscape composition on bird habitats.

Macroscopes on Earth – Why we live in the golden age of satellites
As most of us know, our planet is changing on several fronts such as climate change, polluted oceans, biodiversity declines, land degradation, and so on. But Earth is a big place and keeping tabs on these changes is huge task. There is currently one tool at our disposal that can provide us with the big picture about the health of our planet. That tool is the system of satellites that observes Earth day and night.
New milestone: My paper is now the most read and cited
This is an exciting milestone for me. As of December 13th, my open access study on the Land cover and land use classification performance of machine learning algorithms in a boreal landscape using Sentinel-2 data that was published in 2020 is the most read (22,885) and most cited (101) paper in the journal GIScience & Remote Sensing.
Tutorial: Machine learning classification of Sentinel-2 satellite imagery using R [Updated]
Note: This tutorial was updated on April 20th, 2020 based on reader feedback.
In this short post, I would like to help you conduct your own machine learning classification of Sentinel-2 data using the open source package R. The process is pretty straightforward if you have experience in remote sensing and image classification. Even if you don’t have extensive experience, basic knowledge of remote sensing terminology is sufficient.
Test pixelwise correlation between two time series of gridded satellite data in R
Satellite time series data are useful for studying biophysical how variables change over time and understanding what causes those changes. Recently, I was looking into correlating two time series datasets over Africa to look at the relationship between net primary production (NPP) and rainfall. After a futile attempt to find an “out-of-the-box” software package that does this, I created an R function to speed things up.
Behind the Paper: Comparing machine learning algorithms using Sentinel-2 data
The field of machine learning is moving fast, and it seems that new fancy algorithms coming out every week. Sometimes, it is confusing to figure out which algorithms are best suited for which purpose. This is particularly the case when it comes to land-use and land-cover classification using multidimensional satellite imagery because most of the new algorithms are tested with either binary or uni-dimensional data.