
Tutorial: Machine learning classification of Sentinel-2 satellite imagery using R [Updated]
Note: This tutorial was updated on April 20th, 2020 based on reader feedback.
In this short post, I would like to help you conduct your own machine learning classification of Sentinel-2 data using the open source package R. The process is pretty straightforward if you have experience in remote sensing and image classification. Even if you don’t have extensive experience, basic knowledge of remote sensing terminology is sufficient.
Test pixelwise correlation between two time series of gridded satellite data in R
Satellite time series data are useful for studying biophysical how variables change over time and understanding what causes those changes. Recently, I was looking into correlating two time series datasets over Africa to look at the relationship between net primary production (NPP) and rainfall. After a futile attempt to find an “out-of-the-box” software package that does this, I created an R function to speed things up.
Behind the Paper: Comparing machine learning algorithms using Sentinel-2 data
The field of machine learning is moving fast, and it seems that new fancy algorithms coming out every week. Sometimes, it is confusing to figure out which algorithms are best suited for which purpose. This is particularly the case when it comes to land-use and land-cover classification using multidimensional satellite imagery because most of the new algorithms are tested with either binary or uni-dimensional data.
Behind the Paper: Combining science and art to understand environmental change
A couple of years ago, my colleague and friend Emma Li Johansson approached me with an interesting proposition. Her idea was that the combination of remotely-sensed land cover and and land use change maps and participatory paintings of people’s perceptions of land change might provide useful information in understanding the drivers of change. She didn’t have to say any more because I was sold. It was a solid idea with an innovative interdisciplinary workflow and high potential to provide valuable outcomes.
Oil and opportunities for development in Somalia
For a country that has been at the bottom of global rankings on the basis of transparency, human development, passport power, and safety, oil is seen as a source of hard currency to turn things around and fuel development.
Behind the Paper: Testing a new satellite-derived vegetation index in a new biome
The last chapter of my PhD dissertation was published earlier this year in the International Journal of Applied Earth Observation and Geoinformation. From conception to publication, this paper took about two-and-a-half years of work. It signifies the end of my PhD era, so to speak. The idea came from my supervisor, who suggested that testing the relatively new Plant Phenology Index (PPI) in semi-arid biomes would be a worthwhile cause because its only been evaluated in the boreal biome.
Potential discovery of oil risks eroding the small steps Somalia has taken towards stability
On 2 December 2018, the United States Department of State announced the re-establishment of “permanent diplomatic presence” in Somalia nearly three decades after closing the US embassy in Mogadishu at the onset of the Somali conflict in 1991.
Downward spiral of conflict and famine in Somalia is due to the absence of good governance, not climate
Somalia is mostly dry and semi-arid with the exception of few areas of greenery in the northern mountains or the riverine agricultural fields in the south. Since the acceleration of violence in the late 1980s that propelled it into civil war, two things have been occurring in Somalia on a more or less regular basis: conflicts and famines, and both have been linked, in one way or the other, to climate change
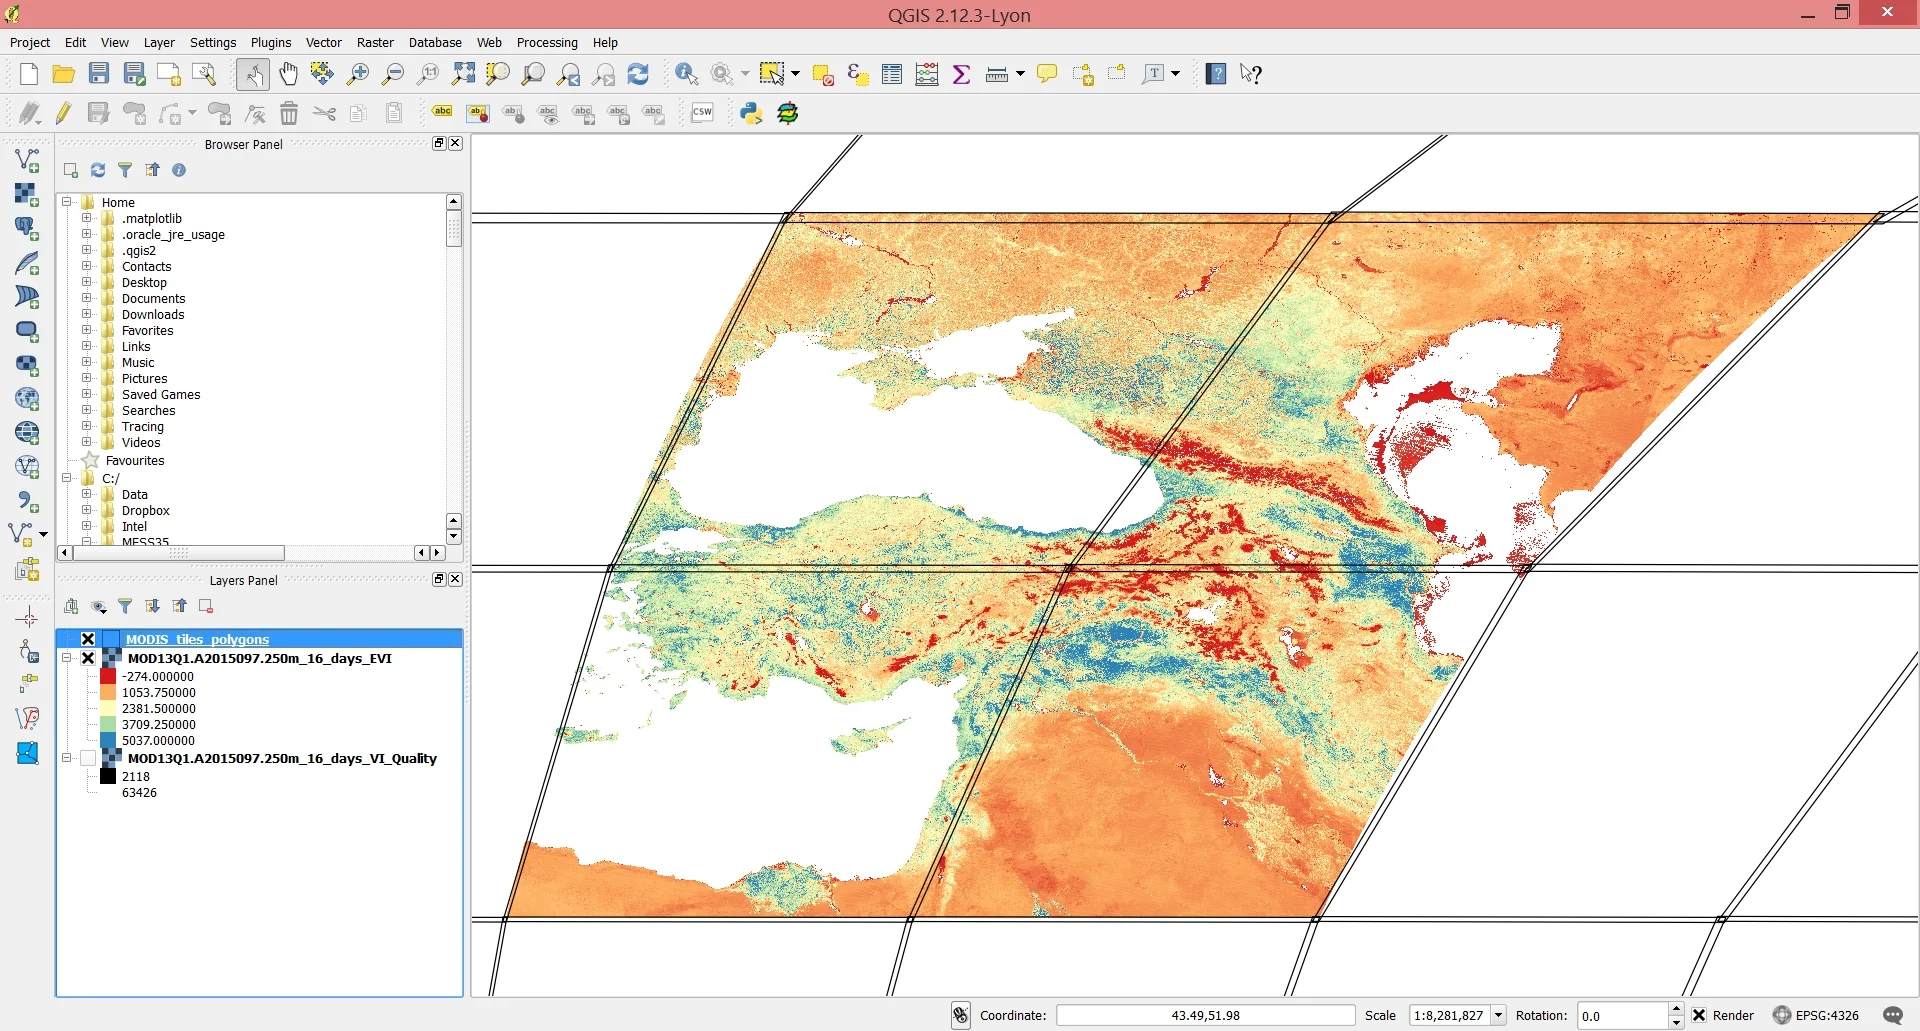
Processing MODIS HDF data using runGDAL
There’s a neat little function in the MODIS package called runGdal that allows, with just a few lines of code, to a) download MODIS data over particular vertical and horizontal coordinates b) extract the desired layer(s) from the HDF-EOS file c) reproject and mosaic your data, and d) save your imagery in geotiff format.

Working with HDF-EOS files in R: convert, project and mosaic
Hierarchical Data Format – Earth Observing System, otherwise known as HDF-EOS or simply HDF, files are the prescribed format for data products from the NASA Earth Observing System satellites: Terra, Aqua and Aura.